


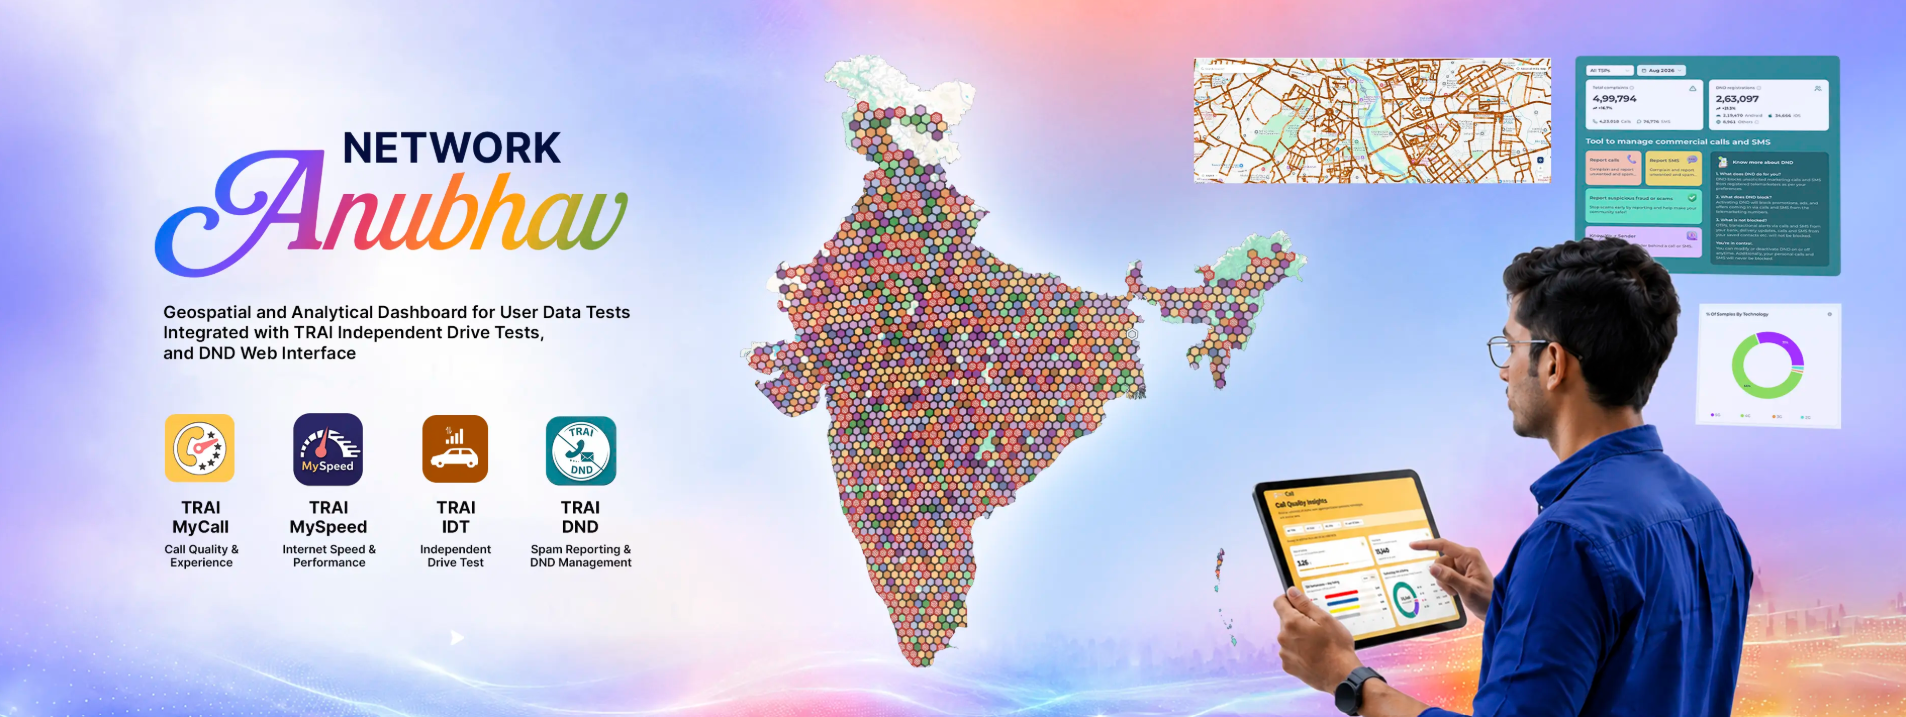
A weak signal at home, slow data near the office or calls that keep dropping can be frustrating. Until now, most people had to rely on personal experience or ask friends which operator worked best in a particular area.
TRAI’s new Network Anubhav platform aims to make that decision easier. Launched on November 4, 2026, the online dashboard shows network test results on a map, allowing people to check mobile and fixed-broadband performance by location, service provider and technology.
What is Network Anubhav?
Network Anubhav is a map-based platform from the Telecom Regulatory Authority of India, or TRAI. It brings together results from users of TRAI’s MySpeed and MyCall apps, along with TRAI’s own Independent Drive Tests.
The platform lets users explore data such as download speed, upload speed, call-quality ratings and coverage observations. A person can zoom into an area, choose an operator and check the available test results before deciding which network may suit them.
For example, someone moving to a new flat in Pune can look at test results around that neighbourhood. If one operator shows more consistent user tests there, it may be worth considering. The same idea can help a small business choose a broadband provider for its office.
What does network quality mapping mean?
Network quality mapping means placing internet and call-quality test results on a location-based map.
It does not create a guarantee that every user will get the same speed. Network performance can change due to a building’s construction, the number of people using the network nearby, handset quality, weather and the time of day.
Still, the map can provide a useful starting point. Instead of seeing only a national advertising claim about 5G speeds, users can view tests submitted from places close to where they live, study or travel.
The dashboard separates results for mobile broadband and fixed broadband. It also allows filtering by telecom company and network technology, such as 4G or 5G.
Understanding the numbers without technical confusion
TRAI uses percentile values to show how results are spread across an area. The most useful one for many users is P50, also called the median speed.
If the P50 download speed in an area is 50Mbps, it means half of recorded tests were at or above 50Mbps, while the other half were below it.
The platform also shows P80 for mobile broadband and P90 for fixed broadband. These figures offer another way to understand consistency. A stronger P80 or P90 result can suggest that speeds remained good in a larger share of recorded tests.
However, TRAI itself says that user-generated tests are not a complete network-quality assessment under standard testing methods. They should be read as real-world experience data, not as a final verdict on an operator.
More than just a speed map
Network Anubhav also includes access to TRAI’s Do Not Disturb, or DND, services through the web. Users can manage promotional-message preferences, report unwanted calls or SMS messages and track complaints.
The platform can help telecom companies too. Operators can view relevant consumer test data through a secure interface and identify locations that may need closer network checks or upgrades.
For TRAI, the combined data can support monitoring of user experience across different regions.
Is it a competitor comparison platform?
Network Anubhav is not a commercial app that declares one telecom company the winner. Instead, it is a public information tool that lets users compare available observations by area.
That difference is important. A network may perform very well in one locality and poorly a few kilometres away. The most useful comparison is therefore the one closest to the place where a person actually uses their phone or broadband connection.
Facts Input & Image Credit – 1, 2, 3
Discover more from Newskart
Subscribe to get the latest posts sent to your email.
